> For the complete documentation index, see [llms.txt](https://docs.qyrus.com/device-farm/llms.txt). Markdown versions of documentation pages are available by appending `.md` to page URLs; this page is available as [Markdown](https://docs.qyrus.com/device-farm/getting-started.md).
# Getting Started
Welcome to Qyrus Device Farm! This section guides you through navigating the platform, utilizing the top navigation bar, taking the interactive product tour, managing projects, filtering execution history, and launching manual, automated, and AI-powered testing sessions on real mobile hardware and desktop browsers.
***
## Top Navigation Bar (Navbar)
The top navigation bar provides global controls, profile management, and quick access to platform tools across all views in Qyrus Device Farm:
* **Service Switcher:** Quickly switch between Qyrus testing services (*Device Farm*, *Web Testing*, *API Testing*, *Mobile Testing*, *Test Management*).
* **Team & Workspace Selector:** Switch between your assigned team workspaces and organizations.
* **Breadcrumbs:** Track your current location within the platform hierarchy (e.g., `Device Farm > Projects > Project Name > Sessions`) and click any ancestor to navigate back instantly.
* **Product Tour Guide Icon:** Click the glowing **Tour Guide** icon on the top right to start or restart the interactive product tour.
* **Notifications & Status Bell:** View real-time platform alerts, build upload completion notices, and test execution status alerts.
* **User Profile & Settings:** Access your profile, manage User API Tokens, toggle token states, configure integrations, view team permissions, and log out.
***
## Interactive Product Tour Guide
For first-time users or team members exploring new features, Qyrus Device Farm includes a built-in **Interactive Tour Guide**:
* **Starting the Tour:** Click the **Product Tour** icon in the top navigation bar (or choose *Product Tour* from the help menu).
* **Guided Walkthrough:** An interactive step-by-step tooltip overlay highlights key areas of the user interface:
1. Creating and managing testing projects.
2. Uploading application binaries (`.apk`, `.ipa`, `.apks`, `.aab`).
3. Configuring Project Tokens and User API Keys.
4. Launching Manual, Automation, and AI testing sessions.
5. Applying network shaping profiles and device filters.
6. Reviewing comprehensive execution reports, vitals graphs, and logs.
* **Dismiss & Resume:** You can exit the tour at any point and relaunch it anytime from the top navigation bar.
***
## Navigating the Dashboard & Dashboard Details
Select the **`Device farm`** service from the top service switcher or left sidebar to open the Device Farm Dashboard.
> 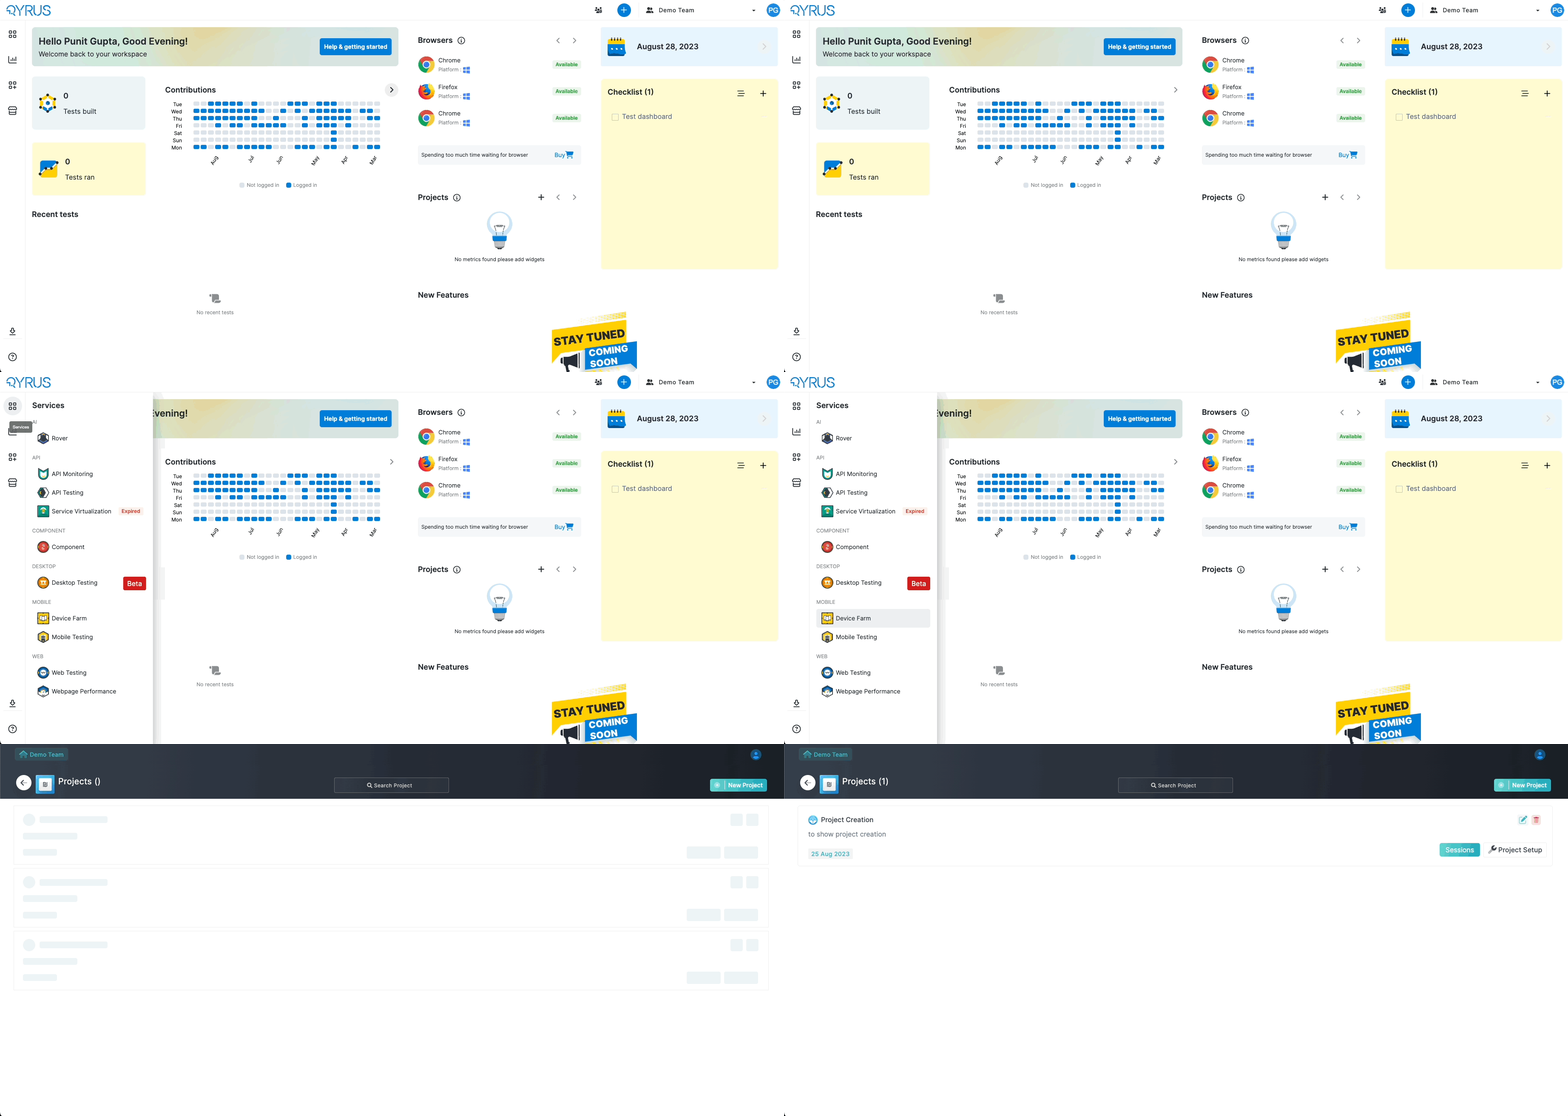 ### Key Dashboard Sections & Metrics:
* **Projects Summary:** Overview of active projects, total test suites, and repository assets.
* **Device Fleet Status:** Real-time visibility into available, busy, and maintenance-state physical devices across global regions.
* **Recent Activity & Executions:** Quick summary cards displaying recent manual and automated test outcomes.
***
## Navigating to Projects
The **Projects** page is the starting hub for organizing your testing activities:
1. **Search Projects:** Use the search bar (`Search Project`) to instantly filter projects by name or description.
2. **Create New Project:** Click the **`New Project`** button to create a new testing workspace.
3. **Project Cards:** Each card displays:
* Project Name & Description
* Quick action buttons: **`Sessions`** (open session history and launch tests) and **`Project Setup`** (manage apps, tokens, network profiles, and integrations).
* Project Edit (pencil) and Delete (trash) actions.
***
## Navigating to History (Sessions Summary) & Filter Details
Click on the **`Sessions`** button on any project card to open the **Sessions History & Execution Summary** dashboard.

### 1. Execution Tabs:
* **Manual Tab:** Displays history and logs for all interactive manual testing sessions and Object Spy sessions.
* **Automation Tab:** Displays all Appium automated test executions, live execution preview cards, and Appium logs.
### 2. Search & Pagination:
* **Quick Search:** Type in the `Search Session...` input box to instantly filter table rows by session name, device, or user.
* **Items Per Page:** Adjust pagination size using the dropdown (`10`, `20`, `50`, or `100` items per page).
### 3. Comprehensive Filter Details:
Click the **`Apply Filters`** button to open the advanced multi-criteria filter menu:
* **Filter By Date Range:**
* Click the interactive Date Range Picker calendar to select custom `Start Date` and `End Date`.
* Filter across preset windows (`All`, `Last 24 Hours`, `Last 7 Days`, `Last 30 Days`).
* **Filter By Region:** Select specific cloud or private data center regions (`US`, `UK/EU`, `IND/AP`, or `All`).
* **Filter By Platform:** Filter by operating system (`Android`, `iOS`, or `Web`).
* **Filter By Session Name:** Search by exact or partial session name.
* **Filter By Device:** Filter executions by device model name (e.g., `Samsung Galaxy S24`, `iPhone 15 Pro`).
* **Filter By User Name:** Filter test executions triggered by specific team members or service accounts.
* **Filter By Application:** Filter by specific application binary package name or build file.
* **Reset & Apply:** Click **Reset** to clear all active filter parameters, or click **Apply** to refresh the grid immediately.
***
## Accessing Real Devices
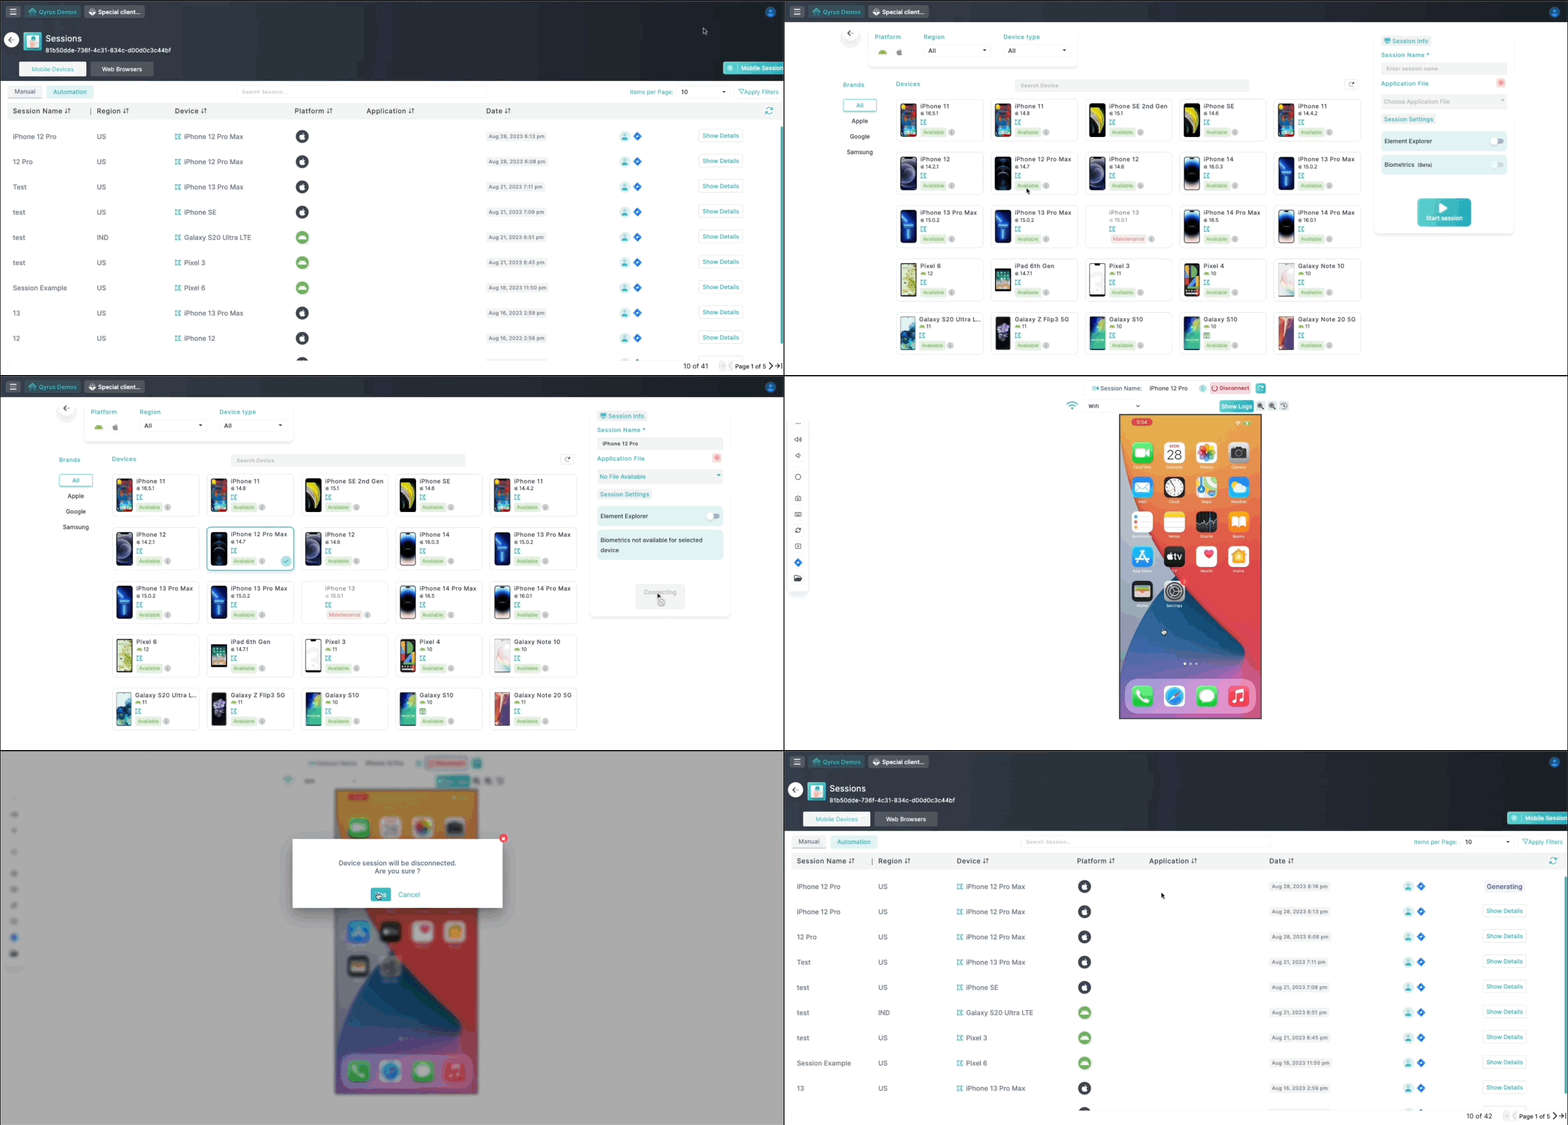
1. **Select a Project:** Choose the project you want to test by clicking on the **`Sessions`** button on the target project card.
> **IMPORTANT:** Ensure that the **`Mobile Devices`** tab is highlighted for the **`Mobile Session`** button to be visible.
2. **Choose a Device:** Click on the **`Mobile Session`** button inside the selected project.
* Filter by **Platform** (Android / iOS), **Region** (Data Center), **Device Type** (Real / Cloud), or **Brand**.
* Review device availability status (`Available`, `Busy`, `Maintenance`) and hardware specs (CPU, RAM, Resolution).
3. **Configure Session Settings:**
* Enter a **Session Name**.
* (Optional) Select an uploaded application binary to install automatically on session launch.
* (Optional) Enable **Element Explorer**, **Biometrics**, or **Reset App** toggles based on your test requirements.
4. **Start Testing:** Click **`Start Session`** to launch the interactive live stream.
5. **End Testing:** Click the **`Disconnect`** (power) button once testing is complete to release the device and generate detailed test reports.
>
### Key Dashboard Sections & Metrics:
* **Projects Summary:** Overview of active projects, total test suites, and repository assets.
* **Device Fleet Status:** Real-time visibility into available, busy, and maintenance-state physical devices across global regions.
* **Recent Activity & Executions:** Quick summary cards displaying recent manual and automated test outcomes.
***
## Navigating to Projects
The **Projects** page is the starting hub for organizing your testing activities:
1. **Search Projects:** Use the search bar (`Search Project`) to instantly filter projects by name or description.
2. **Create New Project:** Click the **`New Project`** button to create a new testing workspace.
3. **Project Cards:** Each card displays:
* Project Name & Description
* Quick action buttons: **`Sessions`** (open session history and launch tests) and **`Project Setup`** (manage apps, tokens, network profiles, and integrations).
* Project Edit (pencil) and Delete (trash) actions.
***
## Navigating to History (Sessions Summary) & Filter Details
Click on the **`Sessions`** button on any project card to open the **Sessions History & Execution Summary** dashboard.

### 1. Execution Tabs:
* **Manual Tab:** Displays history and logs for all interactive manual testing sessions and Object Spy sessions.
* **Automation Tab:** Displays all Appium automated test executions, live execution preview cards, and Appium logs.
### 2. Search & Pagination:
* **Quick Search:** Type in the `Search Session...` input box to instantly filter table rows by session name, device, or user.
* **Items Per Page:** Adjust pagination size using the dropdown (`10`, `20`, `50`, or `100` items per page).
### 3. Comprehensive Filter Details:
Click the **`Apply Filters`** button to open the advanced multi-criteria filter menu:
* **Filter By Date Range:**
* Click the interactive Date Range Picker calendar to select custom `Start Date` and `End Date`.
* Filter across preset windows (`All`, `Last 24 Hours`, `Last 7 Days`, `Last 30 Days`).
* **Filter By Region:** Select specific cloud or private data center regions (`US`, `UK/EU`, `IND/AP`, or `All`).
* **Filter By Platform:** Filter by operating system (`Android`, `iOS`, or `Web`).
* **Filter By Session Name:** Search by exact or partial session name.
* **Filter By Device:** Filter executions by device model name (e.g., `Samsung Galaxy S24`, `iPhone 15 Pro`).
* **Filter By User Name:** Filter test executions triggered by specific team members or service accounts.
* **Filter By Application:** Filter by specific application binary package name or build file.
* **Reset & Apply:** Click **Reset** to clear all active filter parameters, or click **Apply** to refresh the grid immediately.
***
## Accessing Real Devices
1. **Select a Project:** Choose the project you want to test by clicking on the **`Sessions`** button on the target project card.
> **IMPORTANT:** Ensure that the **`Mobile Devices`** tab is highlighted for the **`Mobile Session`** button to be visible.
2. **Choose a Device:** Click on the **`Mobile Session`** button inside the selected project.
* Filter by **Platform** (Android / iOS), **Region** (Data Center), **Device Type** (Real / Cloud), or **Brand**.
* Review device availability status (`Available`, `Busy`, `Maintenance`) and hardware specs (CPU, RAM, Resolution).
3. **Configure Session Settings:**
* Enter a **Session Name**.
* (Optional) Select an uploaded application binary to install automatically on session launch.
* (Optional) Enable **Element Explorer**, **Biometrics**, or **Reset App** toggles based on your test requirements.
4. **Start Testing:** Click **`Start Session`** to launch the interactive live stream.
5. **End Testing:** Click the **`Disconnect`** (power) button once testing is complete to release the device and generate detailed test reports.
>  ***
## Accessing Real Browsers
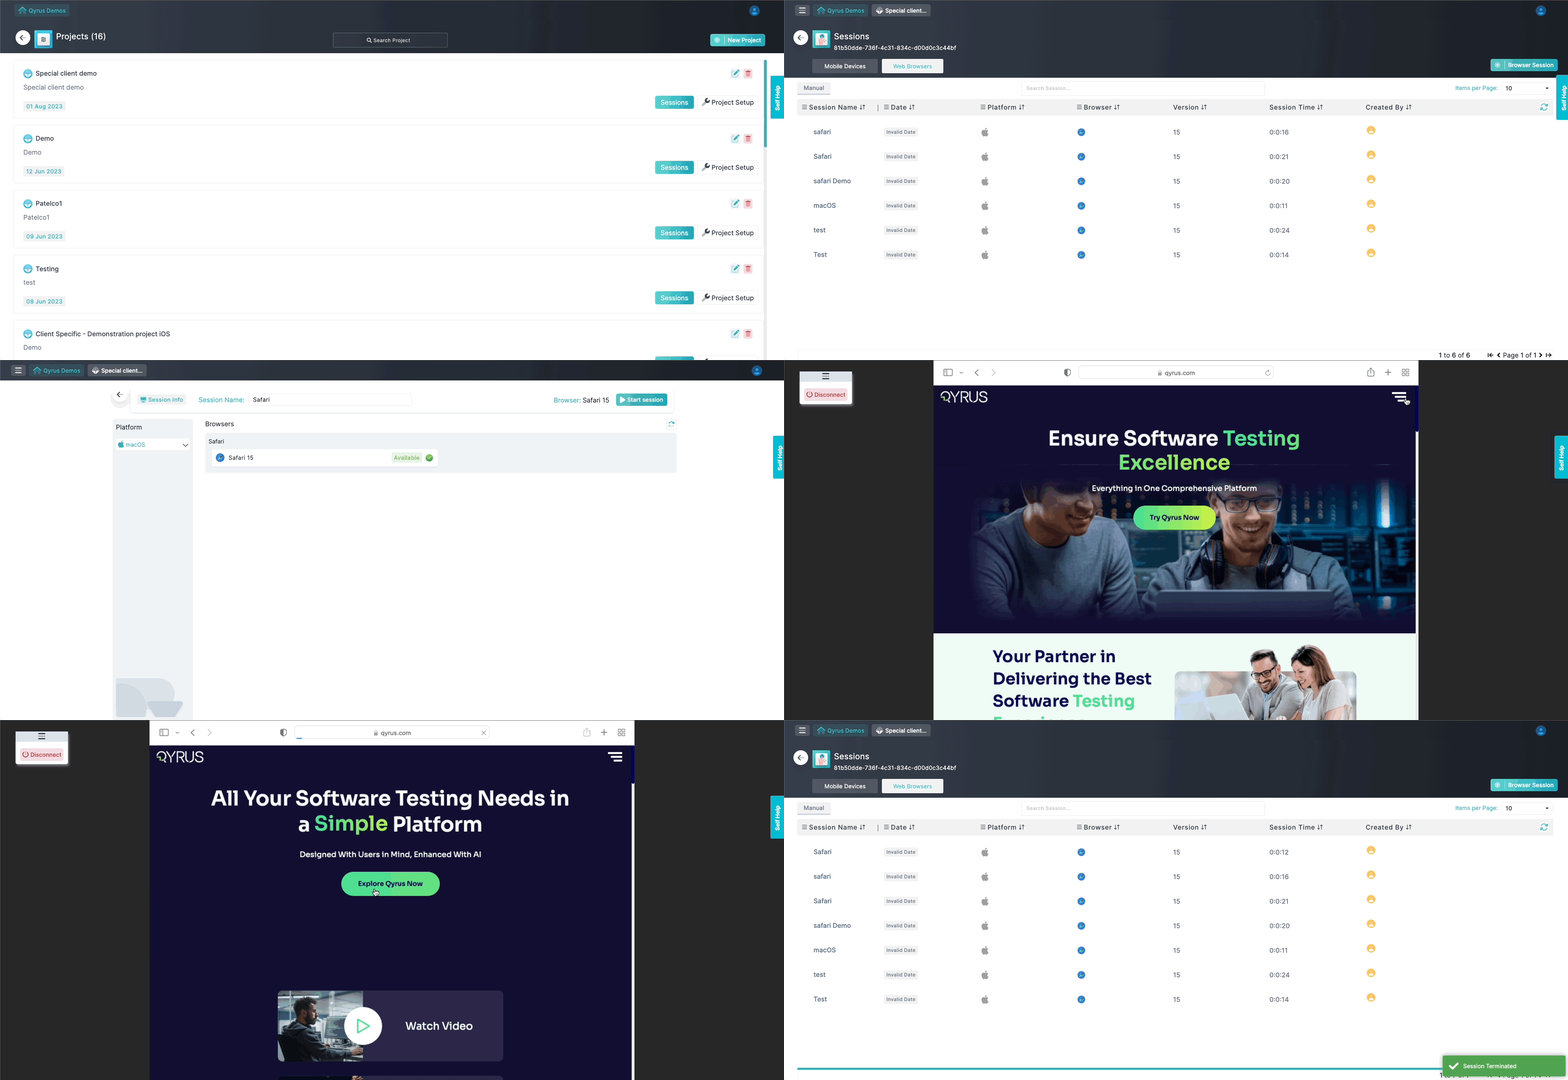
1. **Select a Project:** Choose your project by clicking on the **`Sessions`** button.
2. **Switch to Web Browsers:** Click on the **`Web Browsers`** tab so the browser selection interface is displayed.
> **IMPORTANT:** Make sure that the **`Web Browsers`** tab is highlighted for the **`Browser Sessions`** button to be visible.
3. **Choose a Browser:** Click **`Browser Sessions`** and select your desired browser (Chrome, Firefox, Safari, Edge) and version.
4. **Start Testing:** Enter a **Session Name** and click **`Start Session`** to begin interacting with the browser.
5. **End Testing:** Click **`Disconnect`** on the draggable control bar when your testing is complete.
>
***
## Accessing Real Browsers
1. **Select a Project:** Choose your project by clicking on the **`Sessions`** button.
2. **Switch to Web Browsers:** Click on the **`Web Browsers`** tab so the browser selection interface is displayed.
> **IMPORTANT:** Make sure that the **`Web Browsers`** tab is highlighted for the **`Browser Sessions`** button to be visible.
3. **Choose a Browser:** Click **`Browser Sessions`** and select your desired browser (Chrome, Firefox, Safari, Edge) and version.
4. **Start Testing:** Enter a **Session Name** and click **`Start Session`** to begin interacting with the browser.
5. **End Testing:** Click **`Disconnect`** on the draggable control bar when your testing is complete.
>  ***
## Supported Devices and Browsers
Device Farm provides extensive coverage across modern mobile device models, operating systems, and desktop browsers.
### Mobile Devices:
| Device Platform | Supported Form Factors |
| --------------- | ---------------------------------------- |
| Android | Smartphones, Tablets (Galaxy Tab series) |
| iOS | iPhones, iPads (Pro, Air, Mini) |
### Desktop Browsers:
| Browsers | Supported Versions | Operating System |
| ---------------- | ------------------ | ---------------- |
| Google Chrome | Latest, Latest-1 | Windows, Linux |
| Mozilla Firefox | Latest, Latest-1 | Windows, Linux |
| Apple Safari | Latest, Latest-1 | macOS |
| Microsoft Edge | Latest, Latest-1 | Windows |
| Samsung Internet | Latest, Latest-1 | Android Web |
> For the full catalog of supported devices and DNS whitelisting guidelines, refer to the [Supported Devices and Browsers List](/device-farm/supported-browser-and-device.md).
***
***
## Supported Devices and Browsers
Device Farm provides extensive coverage across modern mobile device models, operating systems, and desktop browsers.
### Mobile Devices:
| Device Platform | Supported Form Factors |
| --------------- | ---------------------------------------- |
| Android | Smartphones, Tablets (Galaxy Tab series) |
| iOS | iPhones, iPads (Pro, Air, Mini) |
### Desktop Browsers:
| Browsers | Supported Versions | Operating System |
| ---------------- | ------------------ | ---------------- |
| Google Chrome | Latest, Latest-1 | Windows, Linux |
| Mozilla Firefox | Latest, Latest-1 | Windows, Linux |
| Apple Safari | Latest, Latest-1 | macOS |
| Microsoft Edge | Latest, Latest-1 | Windows |
| Samsung Internet | Latest, Latest-1 | Android Web |
> For the full catalog of supported devices and DNS whitelisting guidelines, refer to the [Supported Devices and Browsers List](/device-farm/supported-browser-and-device.md).
***